There is no solar instrument in operation that can record spectral, spatial and polarization information within the limits of the short timescale of solar evolution that will be seen by the European SolarnTelescope, write Drs. Michiel van Noort and Alex Feller (Max Planck Institute for Solar System Research, Germany). Developing such instrumentation is key to for detailed spectral analysis of the Sun.
To study the dynamics of the continuously evolving solar atmosphere, it is necessary to obtain morphological information by imaging the solar surface on a time scale that is sufficiently small to effectively "freeze" the solar scene. With the European Solar Telescope we expect to resolve solar structures of order of 30 km which evolve at a time scale of seconds. While an image can be successfully recorded within this short time scale, only a small fraction of the information required for understanding the solar atmosphere is encoded in the image properties alone.
By analyzing in detail the strength, shape and the polarization state of the many spectral lines that are present in the solar spectrum, detailed information about the atmospheric stratification of temperature, vertical bulk motion, magnetic field strength and direction, encoded by atomic line transitions of the many elements that constitute the solar atmosphere, can be obtained. However, for a detailed analysis of the spectral properties of the Sun, a spectrograph with a high spectral resolution must be used.
There is currently no solar instrument in operation that can record spectral, polarization and spatial information within the limits of the short timescale of solar evolution that will be seen by the European Solar Telescope, and with sufficient resolution and sensitivity. Present-day instruments are only able to capture all this information by scanning either spectrally or spatially which takes more time.
A new type of instrumentation is therefore needed for the EST. The Microlens-fed Hyperspectral Imager (MiHI) under development at the Max Planck Institute for Solar System Research is one example of such a new instrument that overcomes this problem by recording the spectral information for each image pixel simultaneously. In order to accomplish this, the pixel must first be reduced in size to create enough space on the two-dimensional image sensor for the spectral information to be dispersed without overlap with the neighboring pixels. The microlens spectrograph uses an assembly of microlens arrays to reduce the pixel size and create space for the spectral information, while minimizing the loss of light. Then the light is dispersed in a spectrograph, forming an array of spectra on the detector.
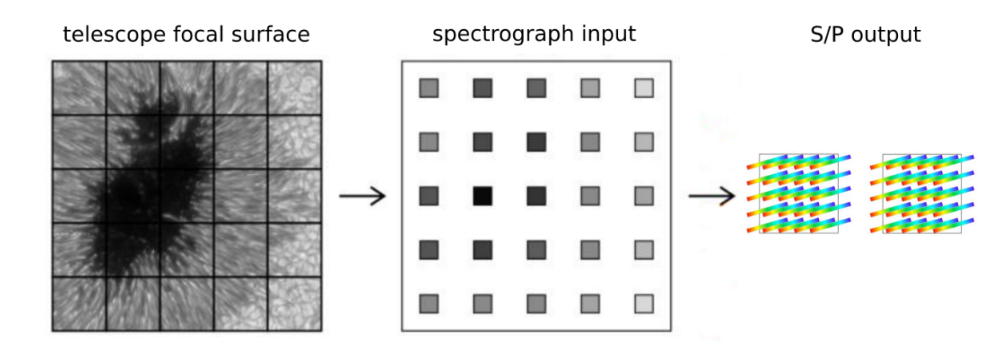
As shown below, in MiHI a two-dimensional image of the solar scene is subdivided into small sub-apertures or image pixels (left panel). The image pixels are then optically reduced in size to create space for the additional spectral information (middle panel). The final result projected on the sensors of the MiHI cameras, after the MiHI beampath has passed a spectrograph, consists of small spectrum stripes, one spectrum for each image pixel (right panel). The current MiHI prototype uses 2 cameras to capture the polarization information as well.
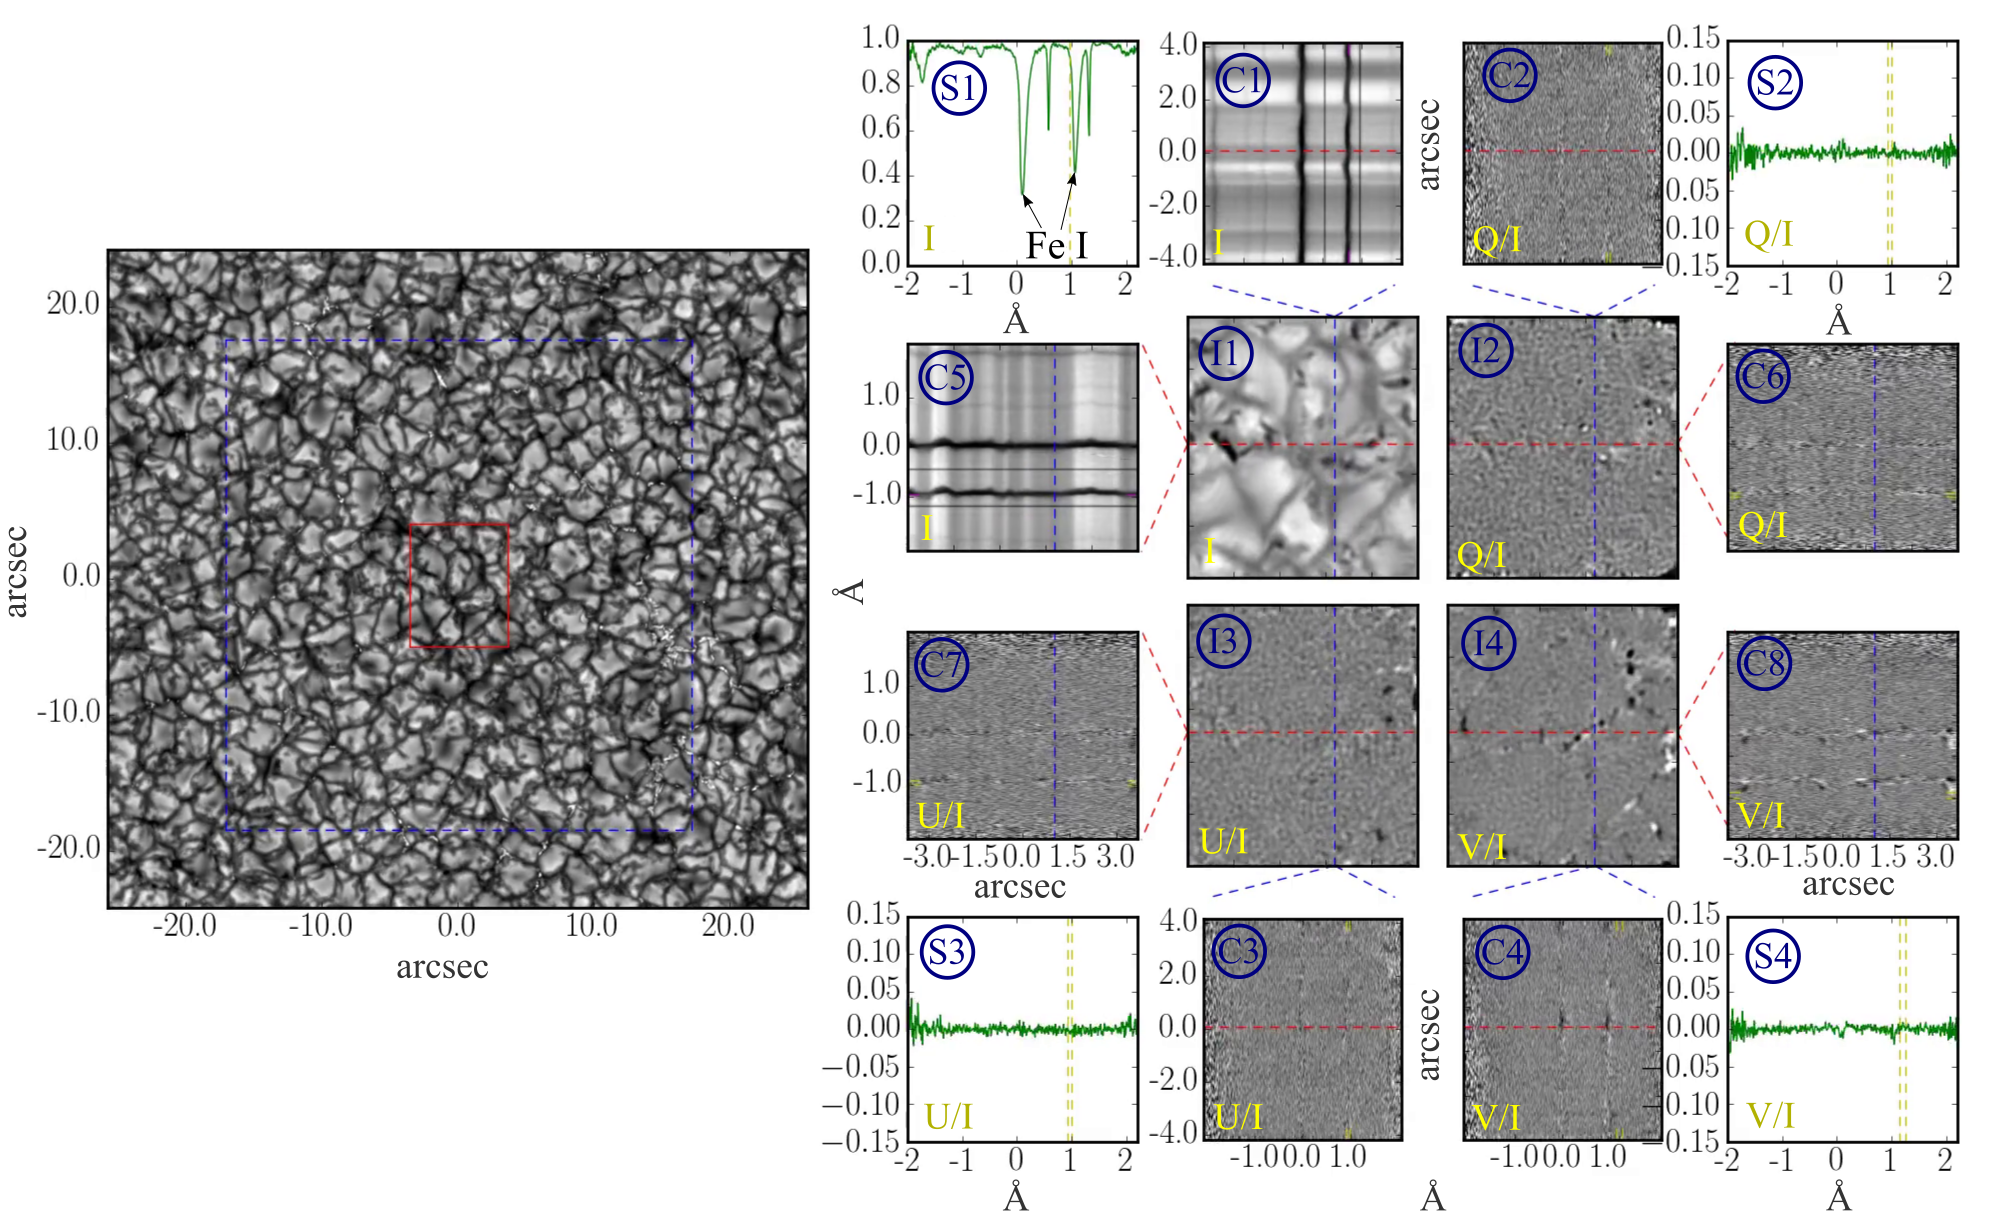
An example observation with a MiHI prototype at the Swedish 1-meter Solar Telescope is given in Figure 2. The red square on the left panel shows the spatial field of view of MiHI within a larger context scene of the solar surface. The small panels on the right show different cuts through the multi-dimensional data cube with spatial, spectral and polarization information recorded simultaneously with MiHI. Panels S1 to S4 show example spectra for the region around 6302 Å containing 2 spectral lines of neutral iron (denoted by ‘Fe I’ in panel S1). S1 shows an intensity (Stokes I) spectrum. Panels S2 to S4 show spectra of the degree of linear polarization (Stokes Q/I and U/I) and circular polarization (Stokes V/I). The horizontal axes represent the relative wavelength. Panels I1 to I4 show two-dimensional spatial images of the MiHI field of view in the 4 polarization states and spectrally averaged across a small region of the spectrum (denoted by the vertical yellow lines in panels S1 to S4). Panels C1 to C8 represent different spectral cuts through those images. The cuts have one spatial dimension and one spectral dimension. In cuts C1 to C4 the horizontal axis represents the spectral dimension. The vertical axis represents the spatial dimension cutting through the images along the blue lines. In cuts C5 to C8 the spectral dimension is vertical and the spatial dimension horizontal, cutting through the images along the red lines. The small structures seen in the images as well as in the Fe I lines in the spectral cuts are signatures of the Zeeman effect, which results from the interaction of the iron atoms with light in the presence of a magnetic field in the solar atmosphere.